


We just published an article in Current Psychology on the direct and indirect relations between socioeconomic status and various developmental factors. This page has a brief summary.
Socioeconomic status
Socioeconomic status, or “SES” to friends, is a pretty nebulous concept. It is an attempt to capture families’ and individuals’ place on the societal ladder, mostly in terms of their affluence and social standing. Obviously, this is very complex, and it won’t come as a surprise that there are as many operational definitions as there are researchers in this field. In other words, everyone measures SES differently. There are a few main themes, though: SES usually comprises income, job, and education.
Here, we used two metrics: questions from a family affluence scale (asking about things like owning a car or dishwasher, and going on vacation abroad), and the UK’s neighbourhood deprivation index (government ranking that takes into account income, employment, education, health, crime, barriers to housing and services, and living environment).
Our study
This article is part of the Resilience in Education and Development project, which runs at the MRC Cognition and Brain Sciences Unit (University of Cambridge). It’s made up of two arms: one where children come into the Unit to get their brains scanned, and another in which our team went out to schools. Children take part twice: once when they are 7-9 years old, and then again two years later. This paper is on data collected during the first school visits.
On each visit, we brought along enough tablet computers to assess all children in a whole classroom at once. (If you’d like to know more about that process, see our earlier blog post on testing children with iPad games.) Our assessment included cognitive tests (e.g. on short-term memory, inhibition, and search organisation), but also child-friendly questionnaires (e.g. on anxiety, family affluence, and conscientiousness), and both reading and maths fluency tests (these relate to how well children do at school).
Our findings
Our findings are complicated, and quite frankly hard to summarise in a pithy way. First, we looked across all the variables we measured, and found that they grouped into 3 to 5 factors: cognition (encompassing mainly fluid reasoning, inhibition, number sense, reading fluency, search organisation, spatial short-term memory, sums fluency, and verbal short-term memory), attitude (comprising conscientiousness, grit, and growth mindset; but also school liking, class distraction, and having a calm home environment), mental health (comprising anxiety and depression symptoms); and speed (comprising processing speed), and socioeconomic status (comprising affluence and deprivation).
Next, we looked at whether the children in our sample grouped together in some way. We used cluster analysis, and found no evidence for such subgrouping. This suggests that there are no discrete “types” of children, but rather that children simply vary along the same dimensions (i.e. the factor structure highlighted above).
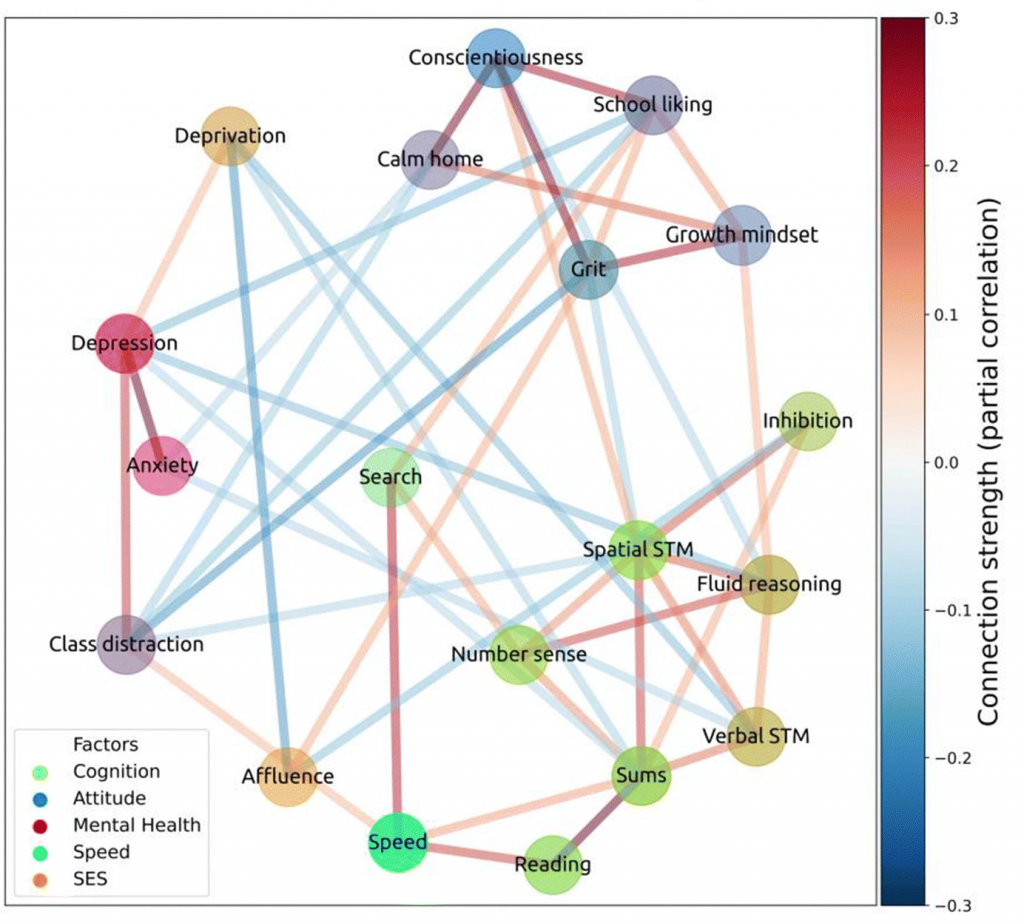
Network of variables measured in 519 children aged 7–9 years. Nodes colours reflect principal components (see legend). Node positions were determined through multi-dimensional scaling, and edge weights through partial correlation. Spurious relations were filtered through bootstrapping. (From Dalmaijer et al., 2021, Current Psychology.)
Finally, we used network analysis. Here, we computed partial correlations, which represent the unique relations between variables. Or at least, something akin to this: For each pair of variables A and B, we regressed out the linear relationship between A and all other variables (C and over), and only then computed the remaining relationship between A and B. For example, to look at the relationship between verbal and spatial short-term memory, we first computed the linear relationship between verbal short-term memory and all other measured variables, then subtracted this from verbal short-term memory, and finally computed the correlation between residual verbal short-term memory and spatial short-term memory. (For a more comprehensive explanation, please do read the paper! It’s linked on the bottom of this page.)
The above partial correlations can be thought of as two-way relations between variables, e.g. between number sense and maths fluency. Taken together, all these two-way connections form a web of relations between all variables. We have visualised this as a network, in which the locations of variables were determined by their proximity in multidimensional space. Or, in normal words: by how similarly participants responded to them.
What this network shows, is that cognitive variables are closely related to each other, and to variables that are related to education (maths and reading fluency). In fact, they’re so close together, that it’s hard to distinguish between them! (This is also why they load onto the same underlying factor.)
Another observation, is that mental health variables (anxiety and depression; here as questions on general symptoms – not diagnostic of syndromes!) show relations with cognitive variables, which in turn relate to maths and reading fluency.
The same is true for attitude variables like conscientiousness, grit, and growth mindset: they relate to some cognitive variables, which in turn relate to maths and reading fluency. Importantly, the three supposedly different variables of conscientiousness, grit, and growth mindset all relate quite strongly, and they appear close together. They also loaded on the same factor. One could argue that the distinction between them is quite blurry, and that maybe we shouldn’t overemphasise their differences or unique importance.
Finally, socioeconomic status related to variables across the board, including in the cognitive, attitude, and mental health domains. This suggests that children’s socioeconomic environment relates quite directly to all domains, and that it’s likely to have further indirect relations due to how variables relate to each other. In other words, socioeconomic disadvantage is likely to reverberate through the network.
One practical thing we can take from the network, is that the relatively easily observable variables of class distraction and school liking are related to variables within the main groups of cognition, attitude, mental health, and SES. On the basis of our data, we can’t really tell what causes what: it could be that children who don’t like school have more depression symptoms and a lower conscientiousness because of their school dislike, or maybe they dislike school because they have more depression symptoms and are less conscientious? Regardless, higher levels of class distraction or school dislike could be something to look out for. (It shouldn’t be overinterpreted or cause for alarm, but it could be a reason to ask a child if they are struggling with something.)
Reference
- Dalmaijer, E.S., Gibbons, S.G., Bignardi, G., Anwyl-Irvine, A., Smith, T., Siugzdaite, R., Uh, S., Johnson, A., & Astle, D.E. (accepted). Direct and indirect links between children’s socio-economic status and education: Pathways via mental health, attitude, and cognition. Current Psychology. doi:10.1007/s12144-021-02232-2